
Donald Knuth famously opined:
“The real problem is that programmers have spent far too much time worrying about efficiency in the wrong places and at the wrong times; premature optimization is the root of all evil (or at least most of it) in programming.”
I broadly agree. It's incredibly difficult to guess which parts of our code will turn out to be performance bottlenecks, and, conversely, which parts will become development bottlenecks because of the obscurity introduced by manual optimization. Eventually one develops instincts for this sort of thing, though they may be of less general applicability than we think, and they may be rapidly outdated by evolution of the computational ecosystem.
There are many sad stories about optimization gone wrong, but this story will be sadder still, because it will be optimization we didn't deliberately perform, but implicitly accepted by choosing to believe in magic.
What we write about when we write about code

It's even debatable whether what we write is actually "code" - in the traditional sense of instructions given to a machine. We certainly type a lot, but what we type gets passed through so many stages of interpretation, compilation, scheduling, rearrangement, speculative second-guessing by the time it comes to actually shooting photons from a pixel, that it might be more accurate to say that we're typing out suggestions to a team of magical animated brooms.
It would be nice to think that our helpers had read Knuth, but, seriously? They're brooms. Moreover, if they don't do any optimization at all, we'll get angry, because they're going to do stupid things like taking forever to fill up a bucket because they insist on checking array bounds after each added drop. Of course if they over-optimize we'll also get angry.
Let's make a hash of it
Not all optimizations are unreasonable. It recently transpired that an assiduous young programmer took the time to profile their code and discovered a surprising hotspot. They had a class like this
  case class Foo(r: Range, thing: String) {
    def bar = r.map {i => s"Once there was a $thing named $thing$i"}
  }
perhaps exactly like this, but probably not. The main thing is that it's a case class, so it has equality semantics, e.g.
Foo(1 to 5) == Foo(1 to 5)
Scala creates the .equals method for us, in a more or less obvious fashion,
requiring both r and thing to match. When you have equality, you also have
to have a compatible .hashCode, and scala defines one of these for us too,
as a combination of hashes of the two members. A good .hashCode is generally
expected to satisfy two criteria. First, there should be no detectable pattern
in the two codes for two distinct items are distributed modulo powers of 2, so
if we use these as keys in a hash table, our buckets will fill up evenly.
Second, they should be much cheaper to compute than full equality,
so we can quickly determine that two
items are different, or that a particular item is not present in a hash table.
So scala is going to have to compute the hash of the Range member, which ought
to be easy, as it's completely determined by its starting, ending and step values,
so we compute three cheap integer hashes and then mix them together (somehow - we'll
see how scala does it later).
But there's a rub. A scala Range is also a Seq, like List and Vector and
so on, and Seqs with like elements are expected to compare and hash equal. So
we can't "cheat" and compute the hashcode of a Range using only the three
integers that describe it; we have to actually elaborate all the numbers in the
Range. While it's incredibly cheap to create a range (0 to Int.MaxValue), it's
incredibly expensive to calculate that range's .hashCode.
(Minor point: in scala, we'll usually use the built-in .## instead of the
java .hashCode method, to comport with scala equality conventions, such
as equality of numbers when represented either as Int or Long.)
What our diligently profiling developer discovered is that their program was spending
an unreasonable amount of time computing Range hashes.
In which I have a clever idea

So, methought, what if we computed the Range hash the cheap way
using just 3 numbers, and for the fully elaborated Seqs, iterate
over them as usual, mixing in hashes for every element, but we check
to see if the difference between elements is constant, i.e. if they
could have been expressed as ranges. If the difference is not
constant, we'll use the full all-element hash; if it is constant,
we'll throw out the full hash and compute the cheap one. The existing
code in the scala collections library looks approximately like:
def hash(a: Array[Int]) = {
  var h = seed
  var i = 0
  while(i < a.length) {
    h = mix(h, a(i).##)
    i += 1
  }
  h
}
and, very roughly, assuming we've checked the length already, we'll change it to:
  var h = mix(mix(seed,a(0).##), a(1).##)
  val diff = a(1) - a(0
  var valid = true
  var i = 2
  while(i < a.length) {
    h = mix(h, a(i).##)
    valid = valid && (a(i) - a(i-1))==diff
  }
  if(valid) rangeHash(a(0),diff,a(i-1))
  else h
We're actually checking the difference in hash codes of the elements rather than the difference in the elements themselves, as this generic method could end up with elements that don't support subtraction. The pathological case of enormous sequences that could have been ranges if only they'd thought of it will now be slightly more expensive, since we compute the hash of three additional elements, but the relevance of that cost goes down as 1/n, we hope.
Here's the actual code we'll be testing:
final def arrayHash[@specialized T](a: Array[T], i0: Int, seed: Int): Int = {
    var h = seed
    var i = i0
    val l = a.length
    while (i < l) {
      val hash = a(i).##
      h = mix(h, hash)
      i += 1
    }
    finalizeHash(h, a.length)
}

final def arrayHashRangeCompatible[@specialized T](a: Array[T], seed: Int): Int = {
    var h = seed
    val l = a.length
    l match {
      case 0 ⇒
        finalizeHash(h, 0)
      case 1 ⇒
        finalizeHash(mix(h, a(0).##), 1)
      case _ ⇒
        val initial = a(0).##
        h = mix(h, initial)
        val h0 = h
        var prev = a(1).##
        val rangeDiff = prev - initial

        var i = 2
        while (i < l) {
          h = mix(h, prev)
          val hash = a(i).##
          if(rangeDiff != hash - prev)
            return oldArrayHash(a, i+1, mix(h, hash))
          prev = hash
          i += 1
        }

        rangeHash(h0, rangeDiff, prev)
    }
  }

  final def rangeHash(h0: Int, diff: Int, end: Int, seed: Int): Int =
    finalizeHash(mix(mix(h0, diff), end), seed)
and these are the mysterious mix functions, straight from the scala 2.13 source:
  final def mix(hash: Int, data: Int): Int = {
    var h = mixLast(hash, data)
    h = rotl(h, 13)
    h * 5 + 0xe6546b64
  }
  final def mixLast(hash: Int, data: Int): Int = {
    var k = data
    k *= 0xcc9e2d51
    k = rotl(k, 15)
    k *= 0x1b873593
    hash ^ k
}
Some form of this range-compatible hash will probably make it into scala 2.13.
Sweet, sweet benchmarking
It's clear that it's going to be fast to calculate the hash code of an actual Range,
which will be O(3),
but it would be prudent to measure the O(n) effect of all the extra code
we added to the original array hash to keep track of whether it could have
been represented as a range.
Benchmarking the performance of java (or any JVM) code is notoriously difficult
(though not, as we'll see,notoriously enough). Java is optimized "just in
time" by JVMs that are clever enough to realize that the timing loop
you wrote doesn't actually do anything and should therefore be optimized away.
We need to play correspondingly clever tricks in order
to produce realistic estimates of the time our code will actually run in real life.
Fortunately, the jdk comes with a tool called jmh
that does all that for us. It's a bit tedious to set up, but ultimately you
get some mvn fu and a bunch of annotations to use.
Actually, I didn't even have to set it up, because
the scala language developers have very responsibly included jmh-based performance tests
for critical code. The relevant piece of benchmark code for one of the
hash computations is roughly:
@BenchmarkMode(Array(Mode.AverageTime)
@Warmup(iterations = 10)
@Measurement(iterations = 10)
@OutputTimeUnit(TimeUnit.NANOSECONDS)

...
  @Benchmark def A_arrayHashOrdered(bh: Blackhole): Unit = {
    val h = MurmurHash3.arrayHashTestOrig(ordered, MurmurHash3.seqSeed)
    bh.consume(h)
  }
When we run this (conveniently, by calling one of scala's sbt tasks),
> bench/jmh:run scala.util.hashing.MurmurHash3Benchmark
something like 10 minutes goes by, and we eventually get a report
[info] MurmurHash3Benchmark.A3_arrayHashOrdered                   10  avgt   20     17.796 ±   0.274  ns/op
[info] MurmurHash3Benchmark.A3_arrayHashOrdered                  100  avgt   20    167.554 ±   2.505  ns/op
[info] MurmurHash3Benchmark.A3_arrayHashOrdered                 1000  avgt   20   1952.867 ±  12.756  ns/op
[info] MurmurHash3Benchmark.A3_arrayHashOrdered                10000  avgt   20  19609.605 ± 400.499  ns/op
[info] MurmurHash3Benchmark.B_rangeOptimizedArrayHashOrdered      10  avgt   20     18.925 ±   0.244  ns/op
[info] MurmurHash3Benchmark.B_rangeOptimizedArrayHashOrdered     100  avgt   20    162.394 ±   1.271  ns/op
[info] MurmurHash3Benchmark.B_rangeOptimizedArrayHashOrdered    1000  avgt   20   1609.690 ±  16.071  ns/op
[info] MurmurHash3Benchmark.B_rangeOptimizedArrayHashOrdered   10000  avgt   20  16111.728 ± 155.433  ns/op
which at first glance looks reasonable - about 19ns to compute the hash of an array of length 10, up from 18s with the original algorithm. But what the hell is going on for the longer arrays? It seems like adding extra work to the algorithm actually made it 20% faster!
News you can use!
On the basis of this happy news, I resolved to add pointless extra
computation to all of my methods, starting with the array hash. I'll keep
track of the previous element's hash in var dork, and call mix on it
instead of hash in the cases where it happens to be the same as hash
anyway. We'll force the computer to decide which of two identical mix
invocations to make:
  final def arrayHashTestStupid[@specialized T](a: Array[T], seed: Int): Int = {
    var h = seed;  var i = 0; val l = a.length
    var dork = seed
    while (i < l) {
      val hash = a(i).##
      if(dork == hash)  h = mix(h, dork)
      else              h = mix(h, hash)
      dork = hash
      i += 1
    }
    finalizeHash(h, a.length)
  }
And it seems to work quite well,
info] Benchmark                                              (size)  Mode  Cnt      Score     Error  Units
[info] MurmurHash3Benchmark.A1_arrayHashOrderedStupid             10  avgt   20     18.778 ±   0.568  ns/op
[info] MurmurHash3Benchmark.A1_arrayHashOrderedStupid            100  avgt   20    163.833 ±   1.548  ns/op
[info] MurmurHash3Benchmark.A1_arrayHashOrderedStupid           1000  avgt   20   1626.775 ±  12.343  ns/op
[info] MurmurHash3Benchmark.A1_arrayHashOrderedStupid          10000  avgt   20  16261.636 ±  75.772  ns/op
a little worse for n=10 but consistently better for large arrays.
Veterinary dentistry

But still.
One is told not to look at such things, but it does seem that this gift horse has something very unusual going on its mouth. Maybe we should look at its, uhm, bite code.
There are various ways to show the byte code that scala (or javac) is generating.
If you're using IntelliJ, this is as easy as View/Show Byte Code. The sheer volume
is a little disorienting, but fortunately the byte code contains markers like
LINENUMBER 137 L10, which means that what follows is the code corresponding to
line 137 in the scala source, and the location in the byte code is now called L10.
[It turns out that, while the byte code makes sense, it doesn't explain the performance anomaly, so feel free to skip this section and go right to the next, even more tedious section.]
So here's what we get for the bit of arrayHash starting with computation of the
hash of the ith element:
   L10
    LINENUMBER 137 L10
    INVOKEVIRTUAL scala/runtime/ScalaRunTime$.array_apply (Ljava/lang/Object;I)Ljava/lang/Object;
    INVOKESTATIC scala/runtime/Statics.anyHash (Ljava/lang/Object;)I
   L11
    ISTORE 7
   L12
Here's the call to mix,
    LINENUMBER 138 L12
    ALOAD 0
    ILOAD 3
    ILOAD 7
    INVOKEVIRTUAL scala/util/hashing/MurmurHash3.mix (II)I
    ISTORE 3
and here's where we increment the index and jump back to the start of the loop.
   L13
    LINENUMBER 139 L13
    ILOAD 4
    ICONST_1
    IADD
    ISTORE 4
   L14
    LINENUMBER 136 L14
    GOTO L8
That seems reasonable enough. Now let's look at the corresponding snippet from
arrayHashTestStupid. It starts out about the same,
   INVOKEVIRTUAL scala/runtime/ScalaRunTime$.array_apply (Ljava/lang/Object;I)Ljava/lang/Object;
   INVOKESTATIC scala/runtime/Statics.anyHash (Ljava/lang/Object;)I
   L11
   ISTORE 7
but here's where we compare hash == dork and jump to L13 if its not true:
L12
    LINENUMBER 151 L12
    ILOAD 6
    ILOAD 7
    IF_ICMPNE L13
If we get here, they must have been equal, so we call mix on dork,
    LINENUMBER 152 L14
    ALOAD 0
    ILOAD 3
    ILOAD 6
    INVOKEVIRTUAL scala/util/hashing/MurmurHash3.mix (II)I
    ISTORE 3
    GOTO L15
otherwise, we jump here and call mix on hash directly:
  L13
    LINENUMBER 154 L13
   FRAME APPEND [I]
    ALOAD 0
    ILOAD 3
    ILOAD 7
    INVOKEVIRTUAL scala/util/hashing/MurmurHash3.mix (II)I
    ISTORE 3
Irrespective of which path we took, here's where we store the
hash in prev, increment i and hop back to the start of the loop:
   L15
    LINENUMBER 155 L15
   FRAME SAME
    ILOAD 7
    ISTORE 6
   L16
    LINENUMBER 156 L16
    ILOAD 4
    ICONST_1
    IADD
    ISTORE 4
   L17
    LINENUMBER 149 L17
    GOTO L8
This makes sense... but there's still nothing that explains why the vandalized code should actually be faster.
Optimal Hell

Of course this isn't the end of the story. The Java JIT (just-in-time) compiler will interpret the byte code at runtime and convert it into actual machine instructions. While humans actually wrote the JVM, it's customary to regard it as a magical artifact that transmutes our high-level source into a perfect match for whatever CPU we happen to be running on.
With a bit more work, we can look behind the curtain, and disassemble the emergent machine code. Doing so requires a few java parameters,
-XX:+UnlockDiagnosticVMOptions -XX:CompileCommand=print,*MurmurHash3.arrayHashTest*
which are googleable enough, but also a plugin called hsdis, not provided by default with
the jdk, to disassemble the machine code into human-readable form. The
openjdk wiki,
unhelpfully advises
Once you succeed in building or downloading the hsdis binary library (in the following named DLL), you have to install it next to your libjvm.so (jvm.dll on Windows), in the same folder.
Fortunately, the source code for the plugin is in the jdk source tree, but building a plugin that worked on my macbook, with my version of java felt like an interminable yak shave. The procedure, generally, is to obtain the source java source,
hg clone http://hg.openjdk.java.net/jdk8/jdk8
cd jdk8
bash ./get_source.sh
and, in the subdirectory for hsdis, untar the the source code for an appropriate
version of GNU binutils:
cd hotspot/src/share/tools/hsdis
wget http://ftp.gnu.org/gnu/binutils/binutils-2.28.1.tar.gz
tar -xf binutils-2.28.1.tar.gz
The trick is finding the precise version of binutils that happens to be
compatible with your version of your OS and with the version of the jdk.
Neither the latest version, 2.31, nor various versions recommended
on the internet over the past 5 years would ultimately compile, so 2.28
may or may not work for you. Once you've got all the source in place,
you run make in the hsdis directory, which will properly configure
and build binutils and incorporate its disassembler in a dynamic
library that you then need to install with the rest of java's libraries.
For me, the alphanumeric specifics were:
make BINUTILS=binutils-2.28.1 all64
sudo cp -p build/macosx-amd64/hsdis-amd64.dylib /Library/Java/JavaVirtualMachines/jdk1.8.0_161.jdk/Contents/Home/jre/lib/server
Shockingly, once built and installed, this worked a treat. I added the
incantatory parameters to javaOpts in the build.sbt, sat back, and watched
my tmux buffer blur with yard after yard of lovely Intel assembly. High-speed
blur turned out to be an interesting way to parse the results. Here's a
side-by-side view, with the original arrayHash on the left and
arrayHashStupid on the right. I've made it too small to read, to make
the point that you can tell something is up just by the layout:
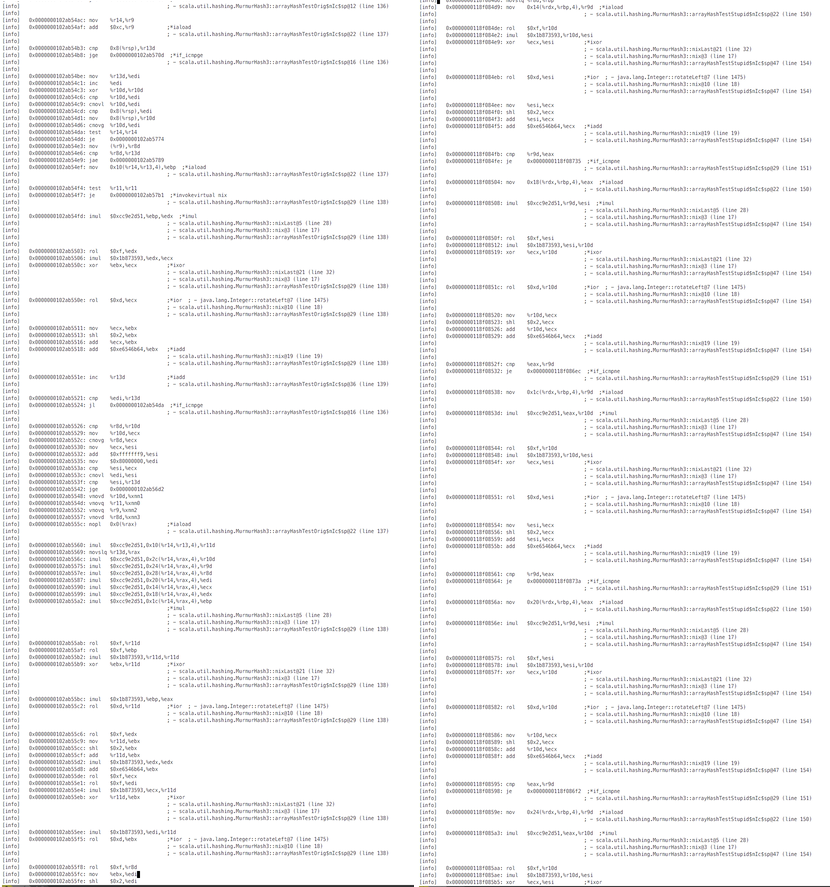
What's interesting is that the original code seems to result in long vertical bands of assembly-looking stuff, with occasional burst of comment text, while the stupid code produces a much more homogeneous pattern of interspersed code and text. Let's zoom in on one of those vertical bands,
[info]   0x0000000102ab5560: imul   $0xcc9e2d51,0x10(%r14,%r13,4),%r11d
[info]   0x0000000102ab5569: movslq %r13d,%rax
[info]   0x0000000102ab556c: imul   $0xcc9e2d51,0x2c(%r14,%rax,4),%r10d
[info]   0x0000000102ab5575: imul   $0xcc9e2d51,0x24(%r14,%rax,4),%r9d
[info]   0x0000000102ab557e: imul   $0xcc9e2d51,0x28(%r14,%rax,4),%r8d
[info]   0x0000000102ab5587: imul   $0xcc9e2d51,0x20(%r14,%rax,4),%edi
[info]   0x0000000102ab5590: imul   $0xcc9e2d51,0x14(%r14,%rax,4),%ecx
[info]   0x0000000102ab5599: imul   $0xcc9e2d51,0x18(%r14,%rax,4),%edx
[info]   0x0000000102ab55a2: imul   $0xcc9e2d51,0x1c(%r14,%rax,4),%ebp
and recall that mixLast contained the line:
k *= 0xcc9e2d51
and that mixLast is called once by mix, which is in turn called once per
iteration in arrayHash. If our instructions were being followed sequentially,
we'd see each of these multiplications interspersed with the bit rotation and
addition in mix, and the computation of each element's hash in arrayHash.
Instead, all the multiplications are occurring in a bunch. It appears that the JVM has
- inlined the calls from
arrayHashtomixtomixLast - unrolled the inner loop into chunks of 8 elements
- rearranged the inlined code so that similar operations occur together
Now let's look at the code following this burst of multiplications. We
see operations apparently corresponding to lines in mix and mixLast,
not applied either iteration-by-iteration or like-operation-by-operation
but scattered about:
[info]   0x0000000102ab55ab: rol    $0xf,%r11d
[info]   0x0000000102ab55af: rol    $0xf,%ebp
[info]   0x0000000102ab55b2: imul   $0x1b873593,%r11d,%r11d
[info]   0x0000000102ab55b9: xor    %ebx,%r11d         ;*ixor
[info]   0x0000000102ab55bc: imul   $0x1b873593,%ebp,%eax
[info]   0x0000000102ab55c2: rol    $0xd,%r11d         ;*ior  ; - java.lang.Integer::rotateLeft@7 (line 1475)
[info]   0x0000000102ab55c6: rol    $0xf,%edx
[info]   0x0000000102ab55c9: mov    %r11d,%ebx
[info]   0x0000000102ab55cc: shl    $0x2,%ebx
[info]   0x0000000102ab55cf: add    %r11d,%ebx
[info]   0x0000000102ab55d2: imul   $0x1b873593,%edx,%edx
[info]   0x0000000102ab55d8: add    $0xe6546b64,%ebx
There are some 15-bit left rotations,
some multiplication by 0x1b873593,
one case of the xor in hash ^ k, a
multiplication by 5 and generally
a great scattering of snippets from mix and mixLast, applied
in some obscure order to various elements of the unrolled iteration
block.
Perhaps the specific arrangement has something to do with assumptions about how my processor (i5-7360U) pipelines and generally performs instruction-level parallelism, but based on the benchmarks it appears that the assumptions were wrong.
The arrayHashStupid assembly, on the other hand, consists of repeated blocks
clearly applicable to a single iteration:
First the multiply, 15-bit rotate, multiply, xor sequence from
mixLast,
[info]   0x0000000107170e54: imul   $0xcc9e2d51,%r9d,%esi  ;*imul
[info]   0x0000000107170e5b: rol    $0xf,%esi
[info]   0x0000000107170e5e: imul   $0x1b873593,%esi,%r10d
[info]   0x0000000107170e65: xor    %ecx,%r10d         ;*ixor
then the 13-bit rotate, sneaky multiplication by 5 and addition in mix,
[info]   0x0000000107170e68: rol    $0xd,%r10d         ;*ior  ; - java.lang.Integer::rotateLeft@7 (line 1475)
[info]   0x0000000107170e6c: mov    %r10d,%ecx
[info]   0x0000000107170e6f: shl    $0x2,%ecx
[info]   0x0000000107170e72: add    %r10d,%ecx
[info]   0x0000000107170e75: add    $0xe6546b64,%ecx   ;*iadd
and finally the pointless conditional I added:
[info]   0x0000000107170e7b: cmp    %eax,%r9d
[info]   0x0000000107170e7e: je     0x0000000107170f78  ;*if_icmpne
There are 8 blocks like this, corresponding to the silly pair of
equivalent mix calls, unrolled into chunks of 4 iterations. Again,
we see unrolling and inlining, but this time we don't see major rearrangement of
the inlined code.
Mystery solved
So the mystery - why ruining the algorithm made it faster - has been solved. We didn't so much make the code better as prevent the JVM from going to great lengths to make it worse. Adding a little bit of complexity deterred the JIT from introducing more of its own.
That is maddening.
Mad as hell

It seems like the JVM has an sick obsession with counter-effective loop-unrolling
strategies, but we don't have to take it anymore. Indeed, if we run with
-XX:LoopUnrollLimit=0, performance seems to be better all around.
[info] MurmurHash3Benchmark.A_arrayHashOrdered            10  avgt   20     17.811 ±   0.252  ns/op
[info] MurmurHash3Benchmark.A_arrayHashOrdered           100  avgt   20    169.959 ±   7.789  ns/op
[info] MurmurHash3Benchmark.A_arrayHashOrdered          1000  avgt   20   1554.601 ±   8.282  ns/op
[info] MurmurHash3Benchmark.A_arrayHashOrdered         10000  avgt   20  16147.977 ± 416.489  ns/op
[info] MurmurHash3Benchmark.C_arrayHashOrderedStupid      10  avgt   20     18.444 ±   0.377  ns/op
[info] MurmurHash3Benchmark.C_arrayHashOrderedStupid     100  avgt   20    163.245 ±   3.010  ns/op
[info] MurmurHash3Benchmark.C_arrayHashOrderedStupid    1000  avgt   20   1566.859 ±  13.584  ns/op
[info] MurmurHash3Benchmark.C_arrayHashOrderedStupid   10000  avgt   20  15893.297 ±  66.690  ns/op
That's in some sense better, but very unsatisfying. If the JVM's loop unrolling is generally useful, then shutting it off everywhere just to make this one routine faster would be a mistake. And if the JVM's loop unrolling is always counter- effective, then we don't want to call attention to the way we've been blindly using it anyway for so long.
Some puns are too stupid even for me

Graal [The VM, not the game, right? Can you find a better illustration? -ed] is worth learning about for many reasons, but for present purposes, the most important reason is that it comes with a modern rewrite of the JIT optimizer. The new JIT seems to be unreasonably effective for scala code (twitter now uses it extensively in production), and we might expect improvements generally, just due to renewed focus on an aspect of the JVM that hasn't received much attention for years. The downside of graal is that its name encourages people to make godawful puns that they quickly regret.
You can download a full graal JRE compatible with Java 1.8 from github.
Re-running the tests with the graal installation directory passed to sbt -java-home,
and no longer explicitly suppressing inlining, we get timings that are not only reasonable,
but better all around:
[info] MurmurHash3Benchmark.A_arrayHashOrdered            10  avgt   20     15.299 ±   0.398  ns/op
[info] MurmurHash3Benchmark.A_arrayHashOrdered           100  avgt   20    158.088 ±   1.905  ns/op
[info] MurmurHash3Benchmark.A_arrayHashOrdered          1000  avgt   20   1592.159 ±  30.341  ns/op
[info] MurmurHash3Benchmark.A_arrayHashOrdered         10000  avgt   20  15584.329 ± 102.944  ns/op
[info] MurmurHash3Benchmark.C_arrayHashOrderedStupid      10  avgt   20     15.667 ±   0.202  ns/op
[info] MurmurHash3Benchmark.C_arrayHashOrderedStupid     100  avgt   20    159.971 ±   1.250  ns/op
[info] MurmurHash3Benchmark.C_arrayHashOrderedStupid    1000  avgt   20   1602.509 ±  32.796  ns/op
[info] MurmurHash3Benchmark.C_arrayHashOrderedStupid   10000  avgt   20  16031.193 ± 318.084  ns/op
As would be reasonably expected, the stupid version is slightly slower than the original, though it is now (pleasantly) surprising how very slightly slower it is. The generated assembly is also a lot less quirky, with two consecutive blocks like,
[info]   0x000000010f481c1d: mov    $0xcc9e2d51,%eax
[info]   0x000000010f481c22: imul   0x10(%rdx),%eax    ; - scala.util.hashing.MurmurHash3::mixLast@3 (line 28)
[info]   0x000000010f481c26: rol    $0xf,%eax          ; - java.lang.Integer::rotateLeft@6 (line 1475)
[info]   0x000000010f481c29: imul   $0x1b873593,%eax,%eax  ; - scala.util.hashing.MurmurHash3::mixLast@17 (line 30)
[info]   0x000000010f481c2f: xor    %eax,%ecx          ; - scala.util.hashing.MurmurHash3::mixLast@21 (line 32)
[info]   0x000000010f481c31: rol    $0xd,%ecx          ; - java.lang.Integer::rotateLeft@6 (line 1475)
[info]   0x000000010f481c34: mov    %ecx,%eax
[info]   0x000000010f481c36: shl    $0x2,%eax
[info]   0x000000010f481c39: add    %ecx,%eax          ; - scala.util.hashing.MurmurHash3::mix@16 (line 19)
[info]   0x000000010f481c3b: lea    -0x19ab949c(%rax),%eax  ; - scala.util.hashing.MurmurHash3::mix@19 (line 19)
showing that the loop has been unrolled by 2, with no significant re-ordering of inlined
code within the iteration. The last line trickily uses the lea (load effective address)
instruction here just to add the 0xe6546b64, which happens to be
the negative of 0x19ab949c.
Note that graal's output is not only faster, but it is much closer to what you might have imagined naively. Much closer, in fact, to a literal transcription of the original algorithm in scala. The optimal performance occurs near the point of minimum optimization.
It's interesting to compare graal here with the output of Intel's latest optimizing compiler,
on a hand-coded C version of arrayHash.
Like graal, icc unrolls the loop into two chunks,
        lea       r10d, DWORD PTR [-234652+rdx+rdx*4]           #14.20
        imul      eax, DWORD PTR [4+rdi+r9*4], -862048943       #5.5
        shl       eax, 15                                       #6.14
        imul      edx, eax, -51821                              #7.5
        xor       r10d, edx                                     #9.19
        shl       r10d, 13                                      #13.14
        lea       edx, DWORD PTR [-430675100+r10+r10*4]         #14.20
(This disassembler likes to print in decimal, but the constants are
the same.) There is some additional trickery - like cramming the
multiplication by 5 into the lea call - but it's all in the category
of taking advantage of documented instructions to compress the code a
little. Once the technique has been explained, you can easily do it
yourself.
Summary: The real magic turns out to be no magic

Testing and benchmarking tell us whether our code behaved acceptably under a particular set of circumstances, but they don't tell us why, or whether the behavior will be robust to other circumstances. As developers, we are continually obliged to acknowledge the limits of our understanding. We can reason thoroughly about the code we write, and perhaps adequately about the code we read, but there will be some layers, beyond or beneath, whose soundness we ultimately need to trust based on incomplete information and reputation. It is therefore reassuring when the functioning of these layers is at least plausibly comprehensible, that we can at least imagine understanding it ourselves if we had enough time, that it is not simply attributed to sorcery. Because sorcery, in addition to being definitively opaque to understanding, is also sometimes dead wrong.
Comments
comments powered by Disqus